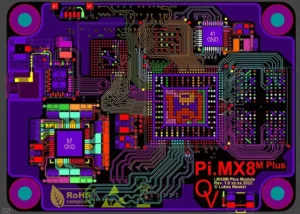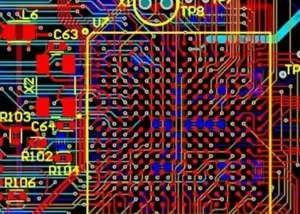
As the trend toward automotive intelligence continues to accelerate, electronic components are becoming increasingly miniaturized and integrated.
Printed circuit board assemblies (PCBAs), as core components of automotive electronics, operate in complex and harsh environments, and their surface insulation performance directly affects product reliability and stability.
Surface Contamination Challenges in Automotive PCBs
During the production of printed circuit boards (PCBs), the use of various types of flux is unavoidable, and flux residues inevitably remain on the surface.
Operators may introduce contaminants, including release agents, solder paste residues, and solder mask oligomers during processing.
Cases of PCB failure caused by these factors are common, resulting in significant economic losses.
Environmental factors, including water vapor and various anions, may corrode PCBA in practical service conditions.
Although the solder mask on PCB surfaces shields circuit patterns during soldering, operators leave components directly exposed to the ambient environment after surface-mount assembly.
Failure to protect the PCB may lead to product failure.
To ensure the insulation and protection performance of PCBs, it is necessary not only to strengthen process control but also to optimize the triple-proof coating process.
Research Status and Existing Limitations
Regarding research on the surface insulation and protection performance of PCBs, many scholars have achieved certain results in various areas.
Nevertheless, driven by continuous innovation in automotive electronic technology, new materials, manufacturing processes and application scenarios keep emerging.
As a result, the influencing factors for the surface insulation performance of automotive PCBs become increasingly complex and diversified.
Existing research still has certain shortcomings in terms of comprehensiveness, systematic approach, and depth.
Research Objectives
This paper aims to explore the influencing factors of surface insulation performance for automotive PCBs.
It also analyzes the action mechanisms of contamination residues and conformal coating processes on such performance.
This research can supply a theoretical foundation and practical guidance for engineers to optimize manufacturing processes and implement reliability evaluation of automotive electronic PCBs.
Experiment
Sample Preparation
1. Preparation of PCB Boards with Different Ion Residue Concentrations
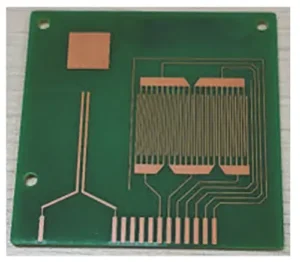
As shown in Figure 1, the test material is an IPC-B-25A standard PCB board made of FR4 epoxy resin, with the Type D comb-shaped pattern serving as the test area.
Researchers adopt isopropyl alcohol as the solvent to dilute undiluted water-based flux and no-clean flux to different volume fractions separately.
Researchers immerse fully cleaned standard PCB boards into these solutions. After taking out and drying the boards, they acquire PCB test samples with different ion residue concentrations.
Measurements taken using the SCS Omegameter SMD 650 static ionic contamination tester (U.S.) showed that the ionic residue concentrations on the PCB surface (expressed as residue per unit area) were 0.5, 1.5, 3.0, 5.0, 7.0, and 12.0 μg/cm².
2. Preparation of PCB Boards with Different Conformal Coating Thicknesses
Take PCB boards with different ion residue concentrations and apply conformal coating to both sides.
Operators adopt the AnDa i-coat5 precision coating machine and atomize the conformal coating raw material under pre-calibrated process parameters.
The coating machine’s nozzle sprays the atomized conformal coating onto the board surface along a predetermined path at a set rate.
The boards are then cured in a tunnel oven, resulting in PCBs with single-sided conformal coating thicknesses of 50, 100, and 150 μm, respectively.
Insulation Performance Evaluation
1. Electrochemical Migration Testing
Ionic contaminants come in many forms and have diverse sources, making them one of the primary causes of electrochemical migration (ECM) in PCBs.
If the concentration of ionic residues exceeds the standard and effective protective measures are not adopted, PCBs are susceptible to insulation failure or short circuits under corrosive media such as water vapor.
This will impair their stability and reliability under service conditions.
This paper employs a rigorous water droplet test method to investigate the effect of ion residue concentration on the occurrence of ECM in PCBs.
First, 5 μL of deionized water was dropped between adjacent electrodes on PCBs with different ion residue concentrations.
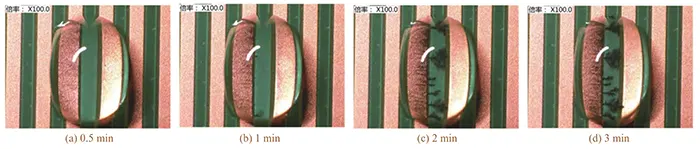
Researchers apply a bias voltage of 2 V to carry out the ECM test and observe ECM phenomena at 0.5 min, 1 min, 2 min and 3 min on PCBs with different ion residue concentrations.
2. Coating Adhesion Testing
Coating adhesion testing is used to evaluate the strength of the bond between the conformal coating and the PCB.
Insufficient coating adhesion can lead to peeling, cracking, or delamination, which affects the coating’s durability and protective performance.
This paper conducts adhesion testing and determines the coating’s adhesion grade in accordance with GB/T 9286—2021, “Paints and Varnishes—Cross-Cut Test.”
Adhesion is classified into six grades: L0, L1, L2, L3, L4, and L5. L0 indicates smooth cut edges with no squares peeling off, while L5 indicates severe peeling.
Engineers regard the coating adhesion reaching Grade L0 or L1 as acceptable for this process.
3. Resistance Testing
Researchers follow the test methods recommended by automotive electronics end customers and place various PCBs inside a temperature-humidity test chamber to carry out cyclic temperature and humidity tests.
Researchers connect the PCBs to a J-RAS ECM-100 ion migration tester (manufactured in Japan) to monitor sample resistance under different temperature and humidity conditions at a constant bias voltage.
This process was used to determine whether short circuits had occurred in the PCBs and, consequently, whether their insulation performance had failed.
The specific test conditions are as follows: temperature 25–65 °C, relative humidity of at least 93%, and a bias voltage of 50 V.
If the PCB’s resistance falls by an order of magnitude below 10⁸ Ω, or if the decrease in resistance exceeds one order of magnitude during temperature and humidity fluctuations, the PCB’s insulation performance is deemed to have failed.
Results and Discussion
Effect of Residual Ion Concentration on the Insulation Properties of PCBs
1. ECM Testing of PCBs with Different Fluxes
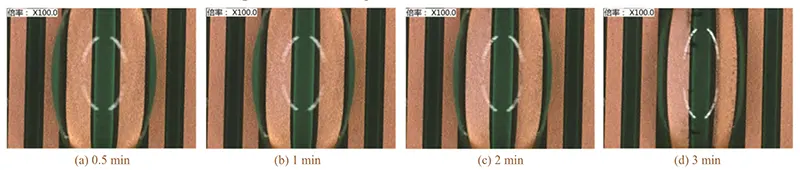
Uncoated PCBs with a residual ion concentration of 0.5 μg/cm² were prepared using water-based and no-clean fluxes, and ECM testing was conducted.
The results are shown in Figures 2 and 3, respectively.
1) ECM Comparison Test of Two Types of Fluxes
ECM occurred immediately after applying a bias voltage for 1 minute with the water-based flux, and by 2 minutes, the dendrites had penetrated the electrodes.
With the no-clean flux, ECM did not occur until 3 minutes after applying the bias voltage, and the dendrites did not penetrate the electrodes.
This indicates that water-based fluxes are more prone to ECM than no-clean fluxes, leading to insulation failure in PCBs.
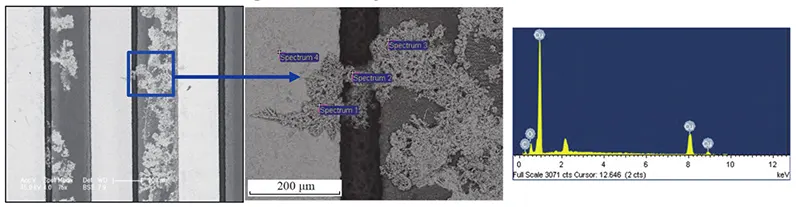
Researchers conduct analysis using an FEI Sirion 200 scanning electron microscope equipped with an Oxford 7462 energy dispersive spectrometer.
The results indicate that the dendrites are mainly composed of Cu, together with trace amounts of C and O (see Figure 4).
This further verifies that electrochemical migration (ECM) takes place between copper electrodes.
2) Ion Chromatography Test of Residual Ions on PCB Surfaces
Using a Thermo Fisher ICS-1000 ion chromatograph, we tested the ion types and concentrations on PCB boards with a total residual ion concentration (expressed as residual amount per unit area) of 7.0 μg/cm² after immersion in different types of flux.
The results are listed in Table 1.
Water-based flux releases a large amount of active ions in the solvent, and its active ingredients are largely unencapsulated by resin.
The total concentration of free ion residues was 6.400 1 μg/cm², which is close to the total ion concentration of the diluted flux solution;
The active ingredient content in no-clean flux is significantly lower than that in water-based flux, and its active ingredients are well encapsulated by the resin.
The measured total concentration of free ions was 2.806 9 μg/cm², which is far lower than the total ion concentration of the diluted flux solution.
3) Mechanism Analysis of Different ECM Susceptibility
Therefore, based on the test results for ion type and residual ion concentration, under bias voltage conditions, water-based flux contains more free active ions, resulting in a higher actual residual ion concentration and a greater likelihood of ECM occurrence.
Unit: μg/cm²
| Flux Type | Cl⁻ | Adipic Acid | Succinic Acid | Br⁻ | Formic Acid | Acetic Acid | Methanesulfonic Acid | Total |
|---|---|---|---|---|---|---|---|---|
| Water-Soluble | 0.0308 | 4.1928 | 1.2701 | 0.0507 | 0.1201 | 0.0683 | 0.6673 | 6.4001 |
| No-Clean | 0.0234 | 0.1516 | 2.0074 | 0.2460 | 0.1033 | 0.0592 | 0.2160 | 2.8069 |
Table 1 Types and concentrations of residual ions on PCB surfaces after immersion in different types of flux
2. ECM Testing of PCBs with Different Ion Residue Concentrations
Researchers prepare uncoated PCBs with different ion residue concentrations by using no-clean flux for subsequent ECM testing.
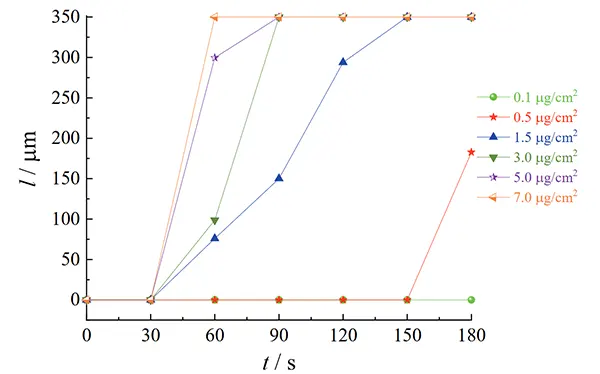
The effect of ion residue concentration on ECM formation in PCBs was investigated by measuring dendrite length at different power-on times.
Since the spacing between adjacent electrodes on the PCBs used was 350 μm, the maximum dendrite size was 350 μm.
As shown in Figure 5, when the ion residue concentration reached 1.5 μg/cm² or higher, dendrites formed between the electrodes within 1 minute;
At an ion residue concentration of 7.0 μg/cm², the dendrites had already penetrated the adjacent electrodes within 1 minute.
Once the dendrites penetrate the electrodes, they cause electrical conduction between them, leading to insulation failure of the product.
This indicates that high residual ion concentrations significantly increase the risk of insulation failure in PCBs.
3. Resistance Testing of PCB Boards at Different Ion Residue Concentrations
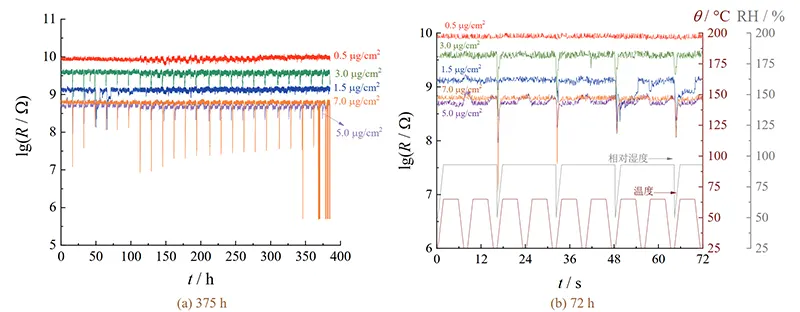
Under alternating temperature and humidity test conditions, the relationship between the resistance of uncoated PCB boards and ion residue concentration is shown in Figure 6.
As shown in Figure 6a, under the same temperature and humidity conditions, when the ion residue concentration does not exceed 7.0 μg/cm², the resistance of the PCB ranges from 1.0 × 10⁸ to 1.0 × 10¹⁰ Ω, with all values remaining at or above the 10⁸ Ω level.
As shown in Figure 6b, researchers observe a negative correlation between PCB resistance and temperature; resistance declines as temperature increases.
Furthermore, the higher the ionic residue concentration, the more significant the decrease in resistance.
The primary reason for this is that when the temperature changes, water vapor easily condenses on the PCB surface, and the presence of liquid water reduces its insulation performance.
The criterion defines insulation performance as unsatisfactory when the resistance decreases by more than one order of magnitude during temperature and humidity variations.
Accordingly, engineers should control the ion residue concentration on uncoated PCBs below 1.5 μg/cm².
4. Effect of Flux Type on PCB Resistance
Figure 7 shows the changes in resistance of PCBs treated with different fluxes, each with a total residual ion concentration of 7.0 μg/cm², under alternating temperature and humidity conditions.
At the same residual ion concentration, the resistances of PCBs treated with the two types of flux were comparable at room temperature, both ranging from 1.0 × 10⁸ to 1.0 × 10⁹ Ω.
However, the resistance of PCBs treated with water-based flux decreased by far more than one order of magnitude when exposed to temperature and humidity fluctuations, and their insulation performance failed to meet protection requirements;
In contrast, the resistance of PCBs treated with no-clean flux fluctuates by less than one order of magnitude in response to changes in temperature and humidity, thereby meeting the product’s requirements for insulation protection.
Mechanism of Flux-Dependent Insulation Performance
Researchers can explain the differing influences of water-based flux and no-clean flux on PCB resistance as follows.
The active ions in no-clean flux are wrapped by resin, which leads to a low concentration of free migratable ions.
By contrast, active ions inside water-based flux escape encapsulation and form abundant free migratable ions (see Table 1).
ECM Behavior at Different Ion Residue Concentrations
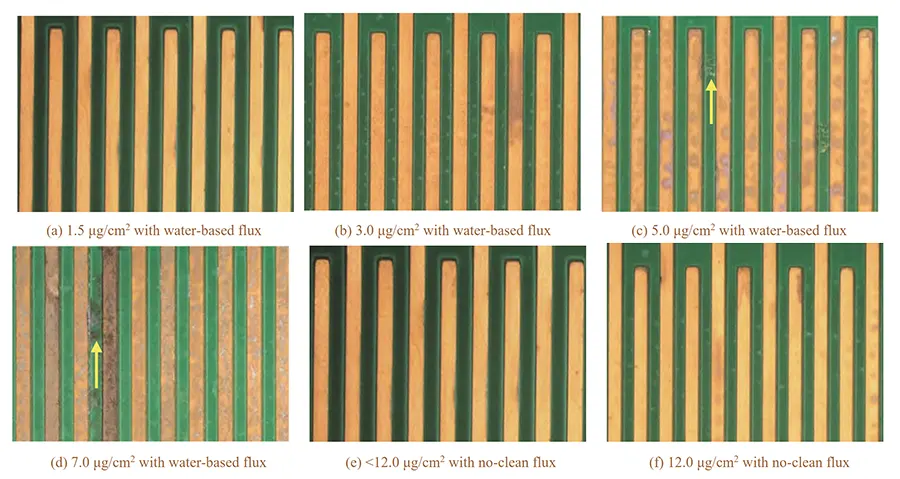
Figure 8 shows the surface optical morphology of uncoated PCBs with different ion residue concentrations, prepared using different types of flux, after undergoing cyclic temperature and humidity testing.
For water-based fluxes, once the ionic residue concentration exceeds 3.0 μg/cm², ECM occurs on PCBs after alternating temperature-humidity tests (as marked by arrows in Figures 8c and 8d), which means the risk of insulation failure of PCBs rises significantly.
For no-clean fluxes, no ECM is detected on PCBs after testing when the ionic residue concentration is below 12 μg/cm².
It demonstrates that PCBs fabricated with no-clean flux have a markedly lower risk of insulation failure compared with those using water-based flux.
The Effect of Conformal Coating Thickness on the Insulation Properties of PCBs
1. The Effect of Conformal Coating Thickness on PCB Resistance
Figure 9 shows the effect of conformal coating thickness on the resistance of PCBs with different ion residue concentrations in an alternating temperature and humidity environment.
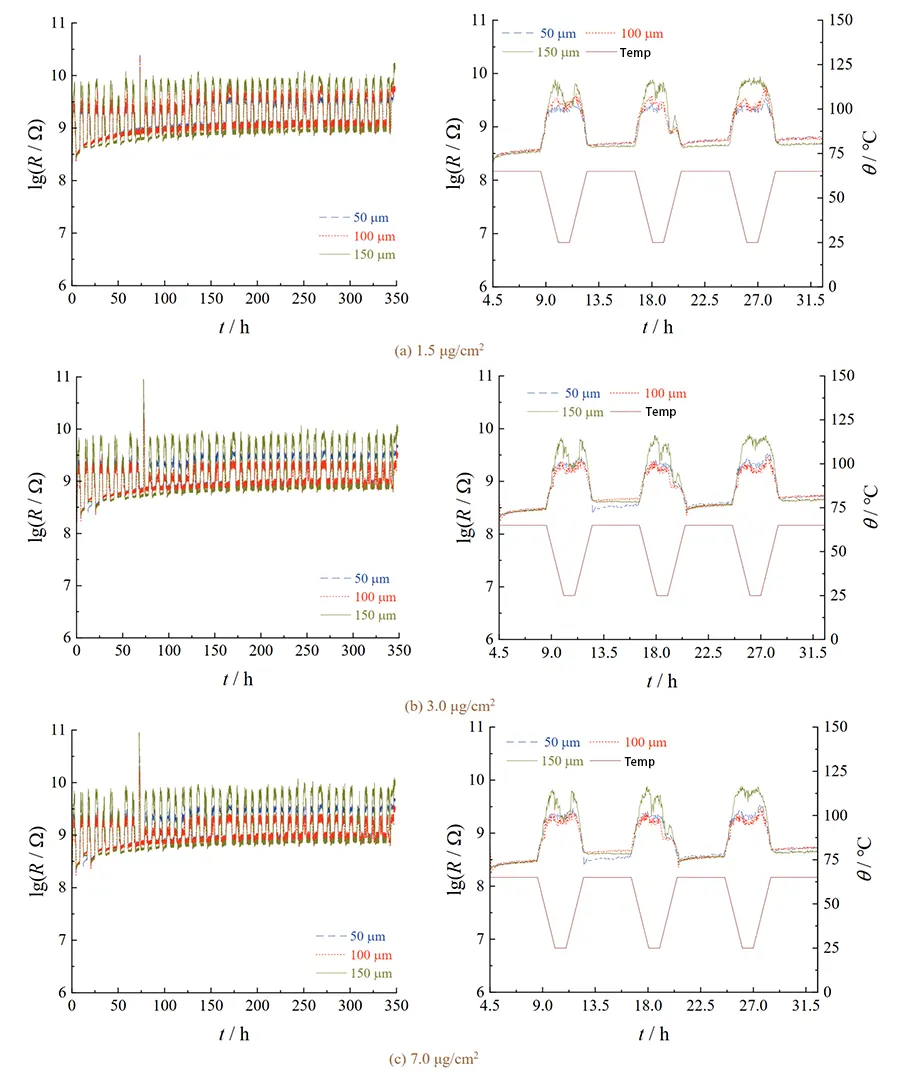
As shown in Figure 9, under the same temperature and humidity conditions, the resistance of the PCB boards varies little with changes in the thickness of the conformal coating and the concentration of ionic residues.
This indicates that simply increasing the thickness of the conformal coating cannot significantly improve the insulation protection performance of samples with different concentrations of ionic residues.
When the ion residue concentration does not exceed 7.0 μg/cm², the resistance of PCBs coated with conformal coating meets insulation protection requirements.
This reveals that conformal coating can block the penetration of water vapor and corrosive gases on the board surface to a certain degree.
It reduces the concentration of migratable ions on the PCB surface and thus decreases the risk of insulation failure.
Under alternating temperature and humidity conditions, the resistance of the PCB decreased as the temperature rose;
During the high-temperature holding phase, the resistance remained at a low plateau and struggled to quickly return to room-temperature levels;
As the temperature decreased, the resistance rebounded accordingly.
On the one hand, as the temperature decreases, water vapor condenses on the PCB surface and gradually penetrates the PCB surface through the polymer network of the conformal coating;
When the temperature rises, the penetrated water vapor cannot evaporate quickly, preventing the resistance from recovering rapidly.
On the other hand, changes in ambient temperature and humidity alter the dielectric constant of the conformal coating, thereby affecting its insulation performance.
2. Evaluation of Solder Mask Adhesion
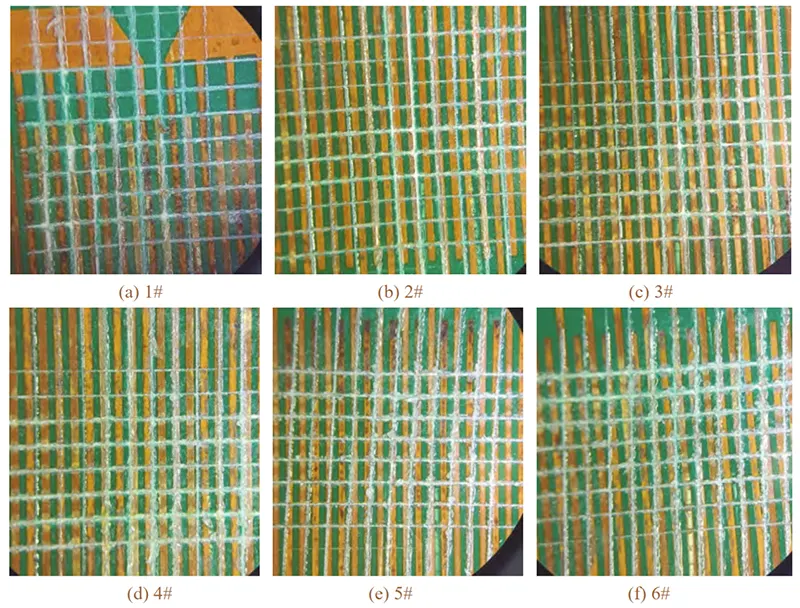
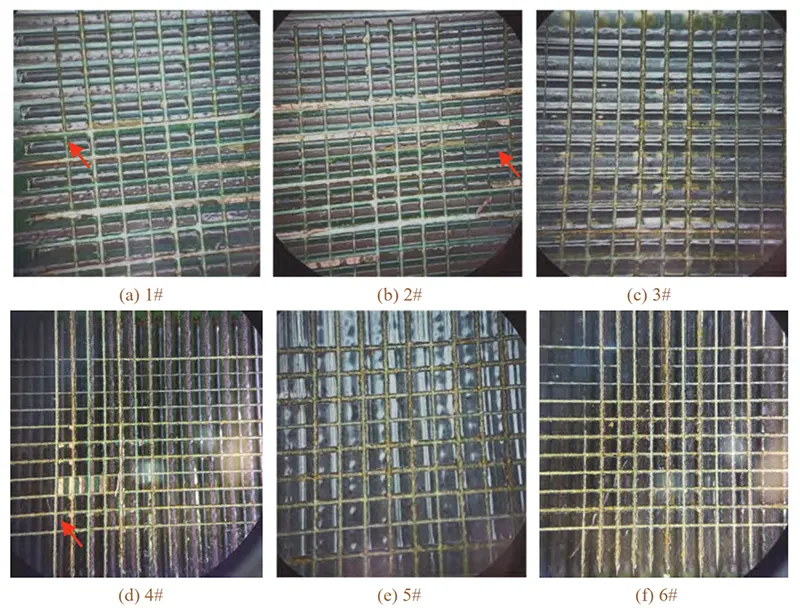
Table 2 shows the adhesion of solder mask coatings on PCB specimens with different ion residue concentrations and different solder mask thicknesses (all water-based fluxes) after 500 h and 3,000 h of alternating temperature and humidity testing.
Photographs of the corresponding specimens are shown in Figures 10 and 11, respectively.
| Sample No. | Ionic Residue Concentration (μg·cm⁻²) | Conformal Coating Thickness (μm) | Conformal Coating Adhesion After 500 h | Conformal Coating Adhesion After 3,000 h |
|---|---|---|---|---|
| 1# | 0.5 | 50 | L1 | L2 |
| 2# | 1.5 | 50 | L1 | L2 |
| 3# | 0.5 | 100 | L1 | L1 |
| 4# | 1.5 | 100 | L1 | L2 |
| 5# | 0.5 | 150 | L1 | L1 |
| 6# | 1.5 | 150 | L1 | L1 |
Table 2 Adhesion of conformal coating after 500 h and 3 000 h of alternating temperature and humidity test
Adhesion Performance after 500 Hours
Table 2 and Figure 10 show that all test specimens achieved a Grade L1 conformal coating adhesion rating after 500 hours of alternating temperature and humidity testing, satisfying the specified requirements.
For products with insulation protection requirements of no more than 500 hours, manufacturers should limit the surface ion residue concentration to 1.5 μg/cm² or less and apply a conformal coating thicker than 50 μm.
Effect of Ion Residue Concentration and Coating Thickness after 3,000 Hours
As shown in Table 2 and Figure 11, as the insulation protection requirements for the product increase, the effects of the ion residue concentration on the PCB surface and the conformal coating thickness on coating adhesion become more pronounced.
When the conformal coating thickness is 50 μm, regardless of the ion residue concentration on the PCB surface, the coating adhesion drops to Grade L2 after the alternating temperature and humidity test, failing to meet the requirements;
When the thickness of the conformal coating rises to 100 μm, higher ionic residue concentration corresponds to lower coating adhesion after alternating temperature-humidity tests.
Under high ionic residue concentration conditions, the adhesion fails to satisfy technical requirements after testing.
Increasing the conformal coating thickness to 150 μm reduces the effect of ion residue concentration on conformal coating adhesion after testing.
For products requiring insulation performance for more than 3,000 hours, manufacturers should control the ion residue concentration on the product surface below 0.5 μg/cm² and apply a conformal coating at least 100 μm thick.
If the ion residue concentration on the board surface exceeds 0.5 μg/cm², manufacturers should increase the conformal coating thickness to at least 150 μm whenever possible or clean the board surface to reduce the ion residue concentration.
Engineering Recommendations
In summary, when the reliability requirements of products are relatively moderate, the conformal coating thickness and ionic residue concentration exert no obvious influence on coating adhesion.
For products with stringent reliability requirements, comprehensive optimization of both PCBA manufacturing process control and conformal coating process is indispensable.
Conclusion
1) The concentration of free ions remaining in liquids such as water vapor is significantly higher for water-based fluxes than for no-clean fluxes.
To reduce the risk of ECM failure, manufacturers should use no-clean fluxes instead of water-based fluxes.
2) For PCBs without conformal coating, when the ion residue concentration exceeds 3.0 μg/cm², their insulation performance will fail to meet requirements under alternating temperature and humidity conditions.
In light of the electronics industry’s standard requirement that surface ion residue concentration must not exceed 1.56 μg/cm², manufacturers should control the ion residue concentration on the board surface below 1.5 μg/cm².
3) For PCBs coated with conformal coating of varying thicknesses, the concentration of ionic residues has no significant impact on their insulation performance.
However, based on product reliability and service life requirements, the concentration of ionic residues can affect coating adhesion.
Engineers shall determine the actual coating thickness according to reliability and service life requirements of products, together with the concentration of ionic residues on board surfaces.