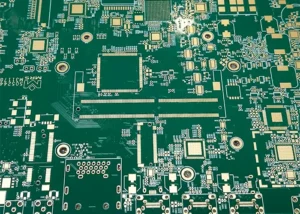
New energy vehicles equipped with intelligent driving and artificial intelligence functions constitute one of the highest-growth segments in the current printed circuit board (PCB) market.
In recent years, the fast advancement of automotive electrification and intelligence has promoted the upgrading of automotive electrical and electronic architectures (EEA).
As key hardware for vehicle intelligence, diverse sensors and domain control units (DCUs) are experiencing rapid market expansion.
QYResearch forecasts that the global market for integrated cockpit and driving domain control units (DCUs) will achieve a compound annual growth rate (CAGR) of 18.5% from 2025 to 2031.
In China, sales of mass-produced vehicles with integrated cockpit-driving systems are expected to increase by 43% year-on-year in 2025.
The corresponding CAGR for 2026–2030 is predicted at 36%.
As a core component of intelligent new-energy vehicles, the DCU’s reliability directly affects the safety of intelligent driving systems.
This trend imposes stricter requirements on the data transmission speed and signal integrity of its supporting PCBs.
The authors have carried out preliminary studies on millimeter-wave radar boards for intelligent vehicles and the reliability of domain-control PCBs.
However, researchers have rarely published systematic studies on automotive-grade material selection for DCU PCBs, ultra-fine-pitch BGA fabrication, and related reliability verification.
Cockpit and autonomous driving technologies continue to advance.
This paper therefore studies the application of automotive high-speed substrates.
This work also examines circuit fabrication based on tenting and the modified semi-additive process (mSAP).
It further targets the control of local high flatness, and assesses the reliability of dense buried vias, blind vias, and through-hole plating.
Additional discussion covers the design and manufacturing of thick-copper thin-dielectric structures.
The outcomes aim to offer practical references for the PCB manufacturing sector.
Evolution of Domain Control Technology in Smart Vehicles
EEA Evolution and Integration with Intelligent Driving
EEA evolves step by step. It shifts from distributed electronic control units (ECUs) to domain-based architectures, and finally to centralized computing architectures.
We divide intelligent vehicles into five classic functional domains: powertrain, chassis, body, cockpit, and autonomous driving.
The powertrain domain manages the vehicle powertrain. It controls components such as the engine, battery and power distribution unit.
The chassis domain controls driving behavior, including braking, transmission, and steering systems;
The cockpit domain controls various electronic information systems, including infotainment, the center console, and instrument clusters;
The body domain controls various body functions, including headlights, windows, and gateway communications;
And the autonomous driving domain controls autonomous driving functions, including rapid processing across the three layers of perception, decision-making, and control.
The specific characteristics and quality control requirements of the corresponding domain-control PCBs vary accordingly.
Currently, there are three major trends in domain control technology development among mainstream automakers:
① The centralization trend, represented by the powertrain domain, which involves further consolidating the powertrain, chassis, and body domains into a single vehicle domain;
② The autonomous driving domain leads this convergence trend.
The cockpit domain and autonomous driving domain support vehicle modernization, intelligence and personalization.
They follow the development route of cockpit-driving convergence (see Table 1).
③ Domain control moves toward centralized computing. Developers adopt cockpit-driving integration and centralized computing.
These schemes cut system costs and share computing resources.
It is projected that by 2027, the penetration rate of the Central Control Unit (CCU) architecture in new vehicles will exceed 30%.
| Stage | Integration Architecture | Technical Roadmap |
|---|---|---|
| Cockpit Separation | Two-board stage (two box/two board) | The cockpit domain and intelligent driving domain operate independently. |
| Cockpit Integration 1.0 | Multi-board stage (multi-board/one box/two board) | Distributed PCBs are installed in a single PCB box and interconnected via high-speed communication (100–1,000 Mb/s). |
| Cockpit Integration 2.0 | Single-board stage (one-board/one box/one board) | Multiple system-on-chip (SoC) units are integrated onto a single PCB and interconnected via PCIe (16 GT/s). |
| Cockpit Integration 3.0 | Single-chip stage (one-chip) | Highly integrated architecture running on a single SoC. |
Table 1. Evolution of Different Technical Architectures for Cockpit Integration
Typical Design Solutions for the Cockpit Domain and Intelligent Driving Domain
High-performance automotive chips fuel the advancement of single-board and single-chip integrated cockpit controllers, as well as autonomous driving domain controllers (DCUs).
Designers allocate different computing resources to DCUs according to autonomous driving levels:
Level 2 DCUs require 10–30 TOPS, Level 3 variants demand 30–100 TOPS, Level 4 units need 200–500 TOPS, and Level 5 implementations are projected to exceed 1000 TOPS.
Component manufacturers now deploy cockpit domain chips delivering CPU computing power of ≥600 kDMIPS.
DMIPS denotes Dhrystone million instructions per second, while TOPS stands for tera operations per second.
Modern SoCs handle expanding data volumes, a shift that pushes PCB developers to move DCU hardware away from conventional multi-layer through-hole boards (MLB).
Instead, engineers adopt high-density interconnect (HDI) structures for these high-speed controllers.
Mainboards are typically 1st- or 2nd-order HDI, while module boards can reach up to 5th or even 6th order;
Their BGA (ball grid array) pitch has been designed down to a minimum of 0.35 mm and is already in use.
Specific design elements for each generation of Qualcomm’s cockpit-domain, autonomous-driving-domain, and integrated cockpit-and-driving SoCs are shown in Table 2.
| Cutting Fluid Type | Number of Parts Machined (pcs) | Machining Process Description |
|---|---|---|
| Nitric acid | 10–15 | High cutting force and high frictional wear |
| Chlorine-containing cutting fluid | 8–12 | Very high cutting force, significant heat generation, and rapid frictional wear |
| Sulfur-containing cutting fluid | 8–10 | Very high cutting force, excessive heat generation, and rapid frictional wear |
Table 2. Number of Parts Machined Using Different Cutting Fluids
Signal Integrity Control for DCU PCBs
As a core component in vehicles, the reliability of materials selected for high-tier HDI PCBs is a primary concern.
Meanwhile, the high-computing integrated cockpit-driving DCU functions as a high-performance computer (HPC).
Signal integrity (SI) restricts further performance gains of this system. Engineers regard SI as a critical limiting factor.
High-Speed Transmission Requirements and Material Selection for Automotive-Grade High-Speed Applications
1. Upgrade of DCU High‑Speed Interface to PCIe 5.0
Designers upgrade DCU high-speed data transmission from PCIe 4.0 to PCIe 5.0.
This upgrade satisfies the requirements of Level 3 and higher advanced driver-assistance systems (ADAS).
DCU PCBs have shorter signal traces than data center server boards.
Engineers impose stricter control targets for insertion loss. PCB structural designs also grow more complex.
The design considerations for domain controller PCBs across different ADAS levels are shown in Table 3.
2. Key Selection Criteria for Automotive High‑Speed Dielectric Materials
Given cost, signal integrity (SI), manufacturability, and reliability requirements, the selection of automotive-grade high-speed materials is critical.
Key considerations include: Glass transition temperature (Tg) and coefficient of thermal expansion (CTE), which are closely related to multiple lamination cycles;
Dielectric constant and loss factor (Dk/Df), which are closely related to SI;
And halogen-free properties and high tracking index (CTI), which are closely related to conductive anode wires (CAF).
The following section presents reliability and SI tests conducted on four typical automotive-grade materials of different grades selected from the industry (see Table 4).
| Intelligent Driving Level | Interface Technology | Transmission Rate (Gbps) | Loss Requirement | Main HDI Stack-up | Application Scenarios & SoC Configuration |
|---|---|---|---|---|---|
| L2–L3 | PCIe 3.0 | 8 | −0.65 dB/in @ 4 GHz | 1+8+1, 2+6+2, 3+4+3, 5+2+5 | Cockpit domain, intelligent driving domain; mainly single-board, single-chip control |
| L2–L4 | PCIe 4.0 | 16 | −0.85 dB/in @ 8 GHz | 2+6+2, 2+8+2, 3+10+3, 5+2+5 | Advanced intelligent driving, cockpit-driving integration; single-board, single-chip or dual-chip |
| L3–L4 | PCIe 5.0 | 32 | −0.96 dB/in @ 16 GHz | 2+8+2, 2+10+2, 3+8+3, 3+12+3 | Cockpit-driving integration, autonomous driving; single-board, dual-chip or quad-chip |
| L4–L5 | PCIe 6.0 | 64 | −1.79 dB/in @ 28 GHz | 3+12+3, 4+8+4 | CCU, autonomous driving |
Table 3. PCB Design Requirements for Different Intelligent Driving Levels
| No. | Material | High-Speed Grade | Halogen-Free | Copper Foil Type | Tg (°C) (DMA) | Z-CTE (%) (50–260°C) | X/Y-CTE (×10⁻⁶/°C) | Dk/Df (10 GHz) | Storage Modulus (GPa) (250°C) |
|---|---|---|---|---|---|---|---|---|---|
| 1 | A | M2 Grade | Yes | RTF | 210 | 1.8 | 11–13 | 3.8/0.019 | 4.3 |
| 2 | B | M4 Grade | Yes | RTF2 | 280 | 1.3 | 9–10 | 3.4/0.008 | 11.5 |
| 3 | C | M6 Grade | Yes | HVLP | 290 | 1.4 | 9–10 | 3.5/0.005 | 10.0 |
| 4 | D | M7 Grade | Yes | HVLP | 200 | 1.8 | 9–10 | 3.2/0.004 | 5.5 |
Table 4. Comparison of Technical Parameters of Automotive-Grade Low-Loss Materials at Different Performance Levels
Note: RTF stands for Reverse Treated Foil, while HVLP stands for Hyper Very Low Profile copper foil. A, B, C, and D are material codes for corresponding grades of copper-clad laminates.
3. Test Stack‑up, Layout Rules and Reliability Validation
Manufacturers implement an identical 4+4+4 HDI stack-up across all four tested materials.
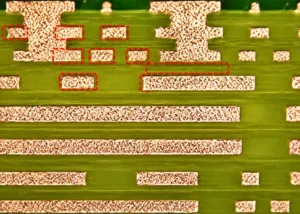
All specimens withstand thermal reliability screening comprising 20 cycles of lead-free reflow with a peak temperature of 260 °C (see Figure 1).
Engineers apply consistent hole-spacing design rules to every material.
The wall-to-wall clearance between blind vias measures 300 μm;
The separation between blind vias and buried vias is 330 μm, while the gap between buried vias and copper edges is set to 100 μm.
Inner-layer traces feature a line width of 63.5 μm and a line spacing of 89 μm.
All material samples complete three lead-free reflow cycles at a peak temperature of 260 °C.
They also pass the 85 °C / 85% RH / 96 h preconditioning test.
The materials further meet the requirements of the CAF test, which runs at 85 °C / 85% RH with a 100 V bias for 1000 h;
Their resistance remains above 10⁸ Ω throughout the test period.
4. Insertion Loss Comparison of Candidate Materials
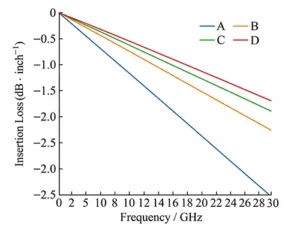
To compare insertion loss performance, researchers select differential pairs designed for 85 Ω ±10% impedance.
These traces adopt a line width of 115 μm and line spacing of 190 μm, as shown in Figure 2.
The insertion loss curves plotted in Figure 2 reveal that only Class C and Class D automotive low-loss materials fulfill the performance target for high-speed domain controllers.
This threshold requires an insertion loss no greater than 1.79 dB/in at 28 GHz.

Fine-Line Fabrication and Characteristic Impedance Control
1. Miniaturization Trend of High‑Order HDI DCU Designs
The BGA pitch and fine-line width/spacing designs for high-order HDI DCU products are trending downward.
This section targets the 4+2+4 HDI cockpit domain board. It adopts 0.35 mm pitch BGA differential traces.
The traces have a line width and spacing of 38 μm / 40 μm. The design uses laser vias of ϕ75 μm on substrates of ϕ155 μm.
Engineers control the on-board differential impedance at (75 ± 5%) Ω.
2. Optimized Alignment Target for Laser Blind Vias
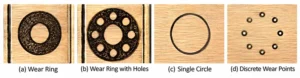
Technicians apply laser direct imaging (LDI) for zone segmentation. They design an annular dot-matrix target for laser blind vias.
This design replaces the traditional single copper pad target (see Figure 3).
The method effectively eliminates alignment errors. These errors arise from repeated lamination and laser drilling in high-layer HDI structures.
It supports stable mass production for laser vias with 40 μm single-sided landing pads.
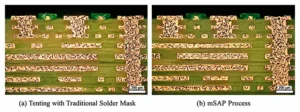
3. Process Comparison between Tenting Etching and mSAP
Meanwhile, researchers select 3 μm low-roughness copper foil as the seed plating layer.
They compare the tenting process and the mSAP process. Both processes target a final copper thickness of (18 ± 3) μm.
The test results demonstrate the process performance.
Operators adopt accurate line-width compensation and optimized vacuum two-fluid etching.
The tenting etching process keeps line width between 38.76 μm and 42.31 μm.
This process delivers a process capability index (Cpk) of 1.36 and an etching factor of 8.6.
The impedance control range was 5.39 Ω, with a corresponding Cpk of 1.26;
For the mSAP process, the line width was controlled within 36.24–38.98 μm, with a Cpk of 1.69, an etching factor of 19.9, an impedance control range of 4.41 Ω·μm, and a corresponding Cpk of 1.45.
It can be seen that the reduction method is comparable to the mSAP process, as shown in Figure 4.
DCU PCB Manufacturing Process and Quality Control
Board Warpage and High Flatness Control
1. Flatness Requirements for BGA Regions of DCU Boards
DCU module board manufacturing involves multiple assembly steps.
Engineers need better reliability for fine-pitch, large-size BGA surface-mount devices.
They mainly aim to stop solder cracking. Thus, the industry imposes stricter flatness requirements on BGA regions.
The target flatness reaches ≤100 μm, or even ≤80 μm.
2. BGA Flatness Test and Material Property Analysis
Researchers carry out comparative tests with the shadow moiré technique.
Figure 5 presents flatness data of PCB samples.
These samples use the four automotive low-loss laminates in Table 4. The test covers temperatures from 30 °C to 260 °C.
The local flatness of the 80 mm × 80 mm BGA region follows this order: B < C < A < D. This trend reveals a clear rule.
Materials with higher storage modulus, higher Tg and lower Z-CTE support better flatness control.
Nevertheless, Type D belongs to automotive M7-grade laminate. It contains high filler loading and shows low resin flow.
The laminate cannot fully release internal stress during lamination. These drawbacks lead to unsatisfactory flatness.

3. Optimization Strategies for BGA Flatness and Warpage Control
Furthermore, symmetrical stack-ups with low-resin-content semi-prepregs are adopted.
The relative residual copper content variation between layers is controlled within ≤5%.
Copper-clad process margins are arranged along the edges of the production panel.
Meanwhile, manufacturing processes are optimized: the holding time during lamination is prolonged to guarantee adequate resin crosslinking, and the cooling stage is extended to facilitate residual thermal stress release.
Additional stress relief measures include Tg-point baking after mechanical drilling and skipped-drilling design.
For a specific 2+6+2 HDI stack-up DCU on Board A in Table 4, the BGA flatness control level was continuously monitored using Shadow Moiré analysis throughout the entire 30–260 °C temperature range.
The improvement was significant, with flatness deviation decreasing from 109.2 μm to ≤60 μm, with overall board warpage ≤0.3%, as shown in Figure 6.

Reliability of High-Density Buried and Blind Vias
1. Reliability Risks of POFV and VOI Combined Structures
The author has previously explained that area-controlled boards should not adopt a design combining plating-over-filled vias (POFV) with blind vias on interposers (via on IVH, VOI).
For area-controlled boards with dense buried via layouts, some samples still fail reliability tests such as 20 cycles of lead-free reflow.
Common countermeasures include slowing down the browning rate, introducing extra drying after browning, and applying chemical etching or plasma etching on the resin layer over buried vias.
These treatments aim to lower board stress adequately so that the boards can survive 20 cycles of lead-free reflow reliability testing.
2. Material T288 Performance and Delamination Risk of Dense Buried Via Clusters
For example, a 3+10+3 HDI structure DCU mainboard with buried via wall spacings ≤0.3 mm and localized clusters of over 50 vias experienced board delamination.
A comparative test was conducted on two high-Tg, halogen-free, low-Dk board materials with very similar technical specifications.
After multiple lamination cycles, significant differences were observed in the measured Tg, Z-CTE, and especially the T288 values (see Table 5).
Halogen-free boards often use DOPO flame retardant formulations; These material formulations trigger defects in some boards.
Repeated high-temperature lamination degrades the resin and makes it brittle. The boards also lose delamination resistance sharply. T288 performance depends mainly on two resin properties at high temperatures.
These properties are cohesive strength and Z-direction bonding strength. T288 greatly affects the thermal resistance and reliability of finished PCBs.
For example, the probability of an “E” failure in Board T288 was 46.5%, while Board F achieved a 100% pass rate. Therefore, Yukong HDI must pay close attention to the T288 performance of actual stacked board assemblies.
| Substrate | Dk/Df (10 GHz) | According to Copper-Clad Laminate Technical Specifications | Measured Results of 3+10+3 Stack-up PCB | ||||
|---|---|---|---|---|---|---|---|
| Tg (°C) (TMA) | Z-CTE (×10⁻⁶/°C) AA–(α1/α2) | T288 (min) | Tg (°C) (TMA) | Z-CTE (×10⁻⁶/°C) AA–(α1/α2) | T288 (min) | ||
| E | 3.5/0.010 | 160.0 | 37/170 | >60 | 149.1 | 55/330 | 0 |
| F | 3.59/0.009 | 165.0 | 35/180 | >60 | 159.1 | 35/245 | 11.43 |
Table 5. Comparison of Key Technical Indicators of Two High-Tg Halogen-Free Substrates and Their Multilayer PCBs
3. Interface Delamination Defects of RTF Copper Foil in Dense Blind Via Regions
Meanwhile, domain-control boards adopt dense blind via designs, with via wall spacing ≤100 μm.
To enhance signal integrity (SI) and support fine-line fabrication, high-speed substrates paired with reverse-treated foil (RTF) copper foil are widely used for HDI lamination.
The adhesion between RTF foil and high-speed resin matrix is relatively low. In dense CO₂ laser drilling regions, localized instantaneous temperature spikes surpass the glass transition temperature (Tg).
The resin softens and expands along the Z-axis, triggering micro-blasting at the RTF copper–resin interface and local delamination of the RTF copper layer.
These defects further lead to failures in the subsequent electroless copper plating process.
4. Optimization Schemes for CO₂ Laser Drilling Parameters
Engineers can substantially mitigate the foregoing defects by selecting high-adhesion RTF copper foil, applying vacuum dehumidification to prepregs prior to lamination, and tuning CO₂ laser parameters to suppress heat accumulation.
Practical optimization covers multiple laser setting revisions. Operators reduce single-pulse energy while raising pulse frequency and decreasing spot overlap rate.
They also reconfigure the laser scanning path.
Control and Improvement of Coating Cracks
1. Thermal Cycle Test (TCT) Acceptance Criteria for NEV DCU Boards
DCU boards for new energy vehicles must meet the requirement that the rate of change in electrical resistance after high- and low-temperature cycling tests (thermal cycle test, TCT) is ≤5%, and no coating cracks at corners or on hole walls are permitted;
Furthermore, any cracks on hole walls must not exceed 10% of the hole’s copper thickness.
2. Root Factors of Plating Cracks in TCT
Many factors contribute to plating cracks during TCT testing. These factors include the board’s Z-CTE.
They also include the curing degree of lamination resin. Residual stress release after lamination matters as well.
Additional influencing factors are board drying after drilling and plating, plating crystallization controlled by electroplating parameters, and the total organic carbon (TOC) level.
3. Effect of Substrate Material Properties on PTH Corner Cracks
In the TCT test of the HDI 3+10+3 DCU main board, samples were cycled 1500 times between −40 °C and 140 °C.
A 5% failure rate caused by coating cracks was detected at the corners of both buried vias and through holes.
This failure mode could not be eliminated by stress-relief measures including baking after lamination, drilling and plating, nor by DC plating thickening treatment using fresh plating baths.
Nevertheless, parallel comparison tests were carried out after replacing Board E with Board F (Table 5).
Corner cracks occurred on Board E after 900 cycles, accompanied by a resistance change rate above 10%.
In contrast, Board F endured 1500 cycles with no cracks observed.
This demonstrates that substrates with higher Tg and lower Z-CTE can significantly reduce corner coating cracks in DCU HDI through-hole (PTH) plating.
4. Influence of Plating Bath TOC on Thermal Cycle Reliability
Comparative thermal cycle testing (TCT) of PTH copper on the HDI 2+6+2 DCU main board was performed between −40 °C and 160 °C for 1000 cycles.
The high-Tg halogen-free laminate (TMA Tg = 170 °C) was processed with identical lamination conditions and plated by direct-current vertical continuous plating (VCP) at the same current density.
The results reveal distinct plating quality when different life-test electrolytes are adopted.
For example, under condition a, the flash plating TOC was 1,072, the VCP TOC was 2,300, while under Condition B, the values were 711 and 926, respectively.
The test results indicate that under Condition A, coating cracks emerged in the TCT sample at only 800 cycles.
The crack length accounted for 9.2% of the plated copper length, and further propagated to 15.7% at 1000 cycles.
Nevertheless, the resistance variation still satisfied the ±5% acceptance criterion.
However, solution B showed no cracking even after 1,000 TCT cycles, with the resistance change rate remaining below ±5%.
We can draw the following conclusion. Higher TOC in the plating bath increases organic impurities inside the copper deposit.
These impurities lower the overall strength of the copper layer. The copper layer therefore resists TCT cracking less effectively.
Therefore, strict control of the plating solution’s TOC is essential for high-reliability DCU boards.
Thick Copper, Thin Dielectric, Thick CAF Reliability
1. Application of Thick Copper Planes for PDN and Thermal Management
As SoC computing power increases, power consumption rises and transient currents grow; thick copper power and ground layers serve as heat dissipation planes and improve thermal management.
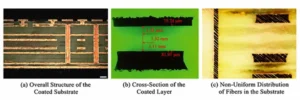
For example, the NVIDIA Thor-U integrated cockpit and driver DCU2+6+2 HDI board requires an inner layer copper base thickness of 70 μm (2 oz), as shown in Figure 7(a).
Designers aim to reduce loop inductance. They also improve the low-frequency impedance of the power distribution network (PDN).
In addition, they control the total board thickness.
For these purposes, they set the dielectric thickness between the thick-copper power plane and its adjacent ground plane to ≤0.100 mm.
The typical target thickness is 0.080 mm.
A representative stack-up uses two pieces of 1037/RC75% resin-impregnated glass fiber prepreg.
Designers place 35 μm copper foil on one side and 70 μm copper foil on the opposite side.
Theoretical lamination model calculations indicate that the resin filling is relatively sufficient, with no risk of lamination voids;
As shown in the cross-sectional inspection of the actual laminated board in Figure 7(b).
2. Resin Uneven Distribution and CAF Failure Risk in Thick-Copper Stack-up
Figure 7(b) shows the feature of 1037 flat glass fiber cloth. This cloth has fine mesh and low permeability.
The 70 μm copper circuit needs plenty of resin to fill gaps. Yet the structure only supplies resin from one single side.
As Table 6 records, the resin layer on the 70 μm copper side averages only 5.70 μm.
Its minimum thickness reaches merely 3.15 μm.
By contrast, the resin layer on the 35 μm copper side averages 11.40 μm. Its minimum value is 9.25 μm.
Due to the actual thinness of the resin layer, the 70 μm copper-side is highly prone to CAF failure, as shown in Figure 7 (c).
Improvement tests indicate that using a stackup design consisting of two 1,037/RC79% sheets with a higher resin content or two 1,080/RC69% sheets with better permeability can effectively resolve this issue.
| Item | Nominal Value | Measurement 1 | Measurement 2 | Measurement 3 | Measurement 4 | Measurement 5 | Measurement 6 | Measurement 7 | Measurement 8 | Measurement 9 | Measurement 10 | Average |
|---|---|---|---|---|---|---|---|---|---|---|---|---|
| 35 μm Base Copper Thickness | — | 28.20 | 30.25 | 25.64 | 27.69 | 28.20 | 30.00 | 30.00 | 28.72 | 30.51 | 27.95 | 28.72 |
| 35 μm Side Resin Layer Thickness | 15.50 | 13.08 | 10.12 | 11.79 | 11.49 | 14.13 | 10.21 | 9.25 | 11.28 | 10.26 | 12.38 | 11.40 |
| Fiberglass Cloth Thickness | 27.00 | 25.64 | 23.08 | 23.51 | 23.05 | 27.18 | 25.64 | 25.51 | 23.74 | 23.85 | 23.72 | 24.49 |
| Resin Layer Thickness Between Fiberglass Cloths | 31.00 | 20.77 | 25.13 | 21.79 | 22.82 | 23.20 | 22.05 | 22.31 | 22.28 | 24.36 | 23.41 | 22.81 |
| Fiberglass Cloth Thickness | 27.00 | 23.23 | 24.02 | 23.08 | 24.54 | 23.46 | 23.08 | 23.69 | 22.54 | 23.30 | 24.87 | 23.58 |
| 70 μm Side Resin Layer Thickness | 15.50 | 5.20 | 3.15 | 5.51 | 4.59 | 4.95 | 6.61 | 5.23 | 8.20 | 5.31 | 8.27 | 5.70 |
| 70 μm Base Copper Thickness | — | 60.00 | 61.79 | 62.56 | 60.51 | 60.00 | 62.30 | 61.79 | 60.00 | 62.05 | 61.28 | 61.23 |
Table 6. Dielectric Thickness Measurement Data from Dark-Field Microsections of 35 μm/70 μm Traces with 1037/RC75% Resin Fill on Two Panels
Unit: μm
Conclusion
In recent years, the rapid growth of the new energy and autonomous vehicle market has brought new opportunities and challenges to the development of high-end domain-controlled PCBs.
Among these, the cockpit-and-driving-integrated DCU PCB—which features high computing power, high current capacity, and superior heat dissipation—is a typical example of a high-tier, high-performance, and high-value HDI product.
This paper systematically reviews the technological evolution of DCUs and their typical PCB design elements, demonstrating the role of M6-grade and higher automotive-grade high-speed materials in supporting high-speed domain control SI performance metrics of ≤1.79 dB/inch at 28 GHz.
At the process level, this paper verifies the equivalence of the tenting method and the mSAP process in the fabrication of high-density HDI boards featuring 0.35 mm pitch BGA with two-wire penetration.
At the performance level, through optimized design and process control, a breakthrough was achieved with a surface roughness of ≤60 μm across the entire temperature range of 30–260 °C;
We conducted an in-depth analysis of the causes and countermeasures for delamination and plating cracks in high-density buried/blind via PCBs;
And established a CAF reliability design model for PCBs with thick copper and thin dielectric layers.
The key technologies and implementation pathways proposed in this study can serve as a reference for related industries.